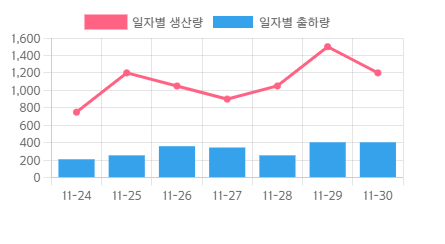
chart.js 를 사용할 때, canvas의 크기(width, height)를 조절하고 싶다.
아주 간단하다.
canvas를 감싸고 있는 div 태그를 하나 만들고, div 태그에 position: relative를 적용한 뒤, width, height 를 작성하면 된다.
예시)
<div style="position: relative; height:600px; width:400px;">
<canvas id="myCanvas" >
Your browser does not support the canvas element
</canvas>
</div>
그러면 변한 사이즈를 확인할 수 있다.

물론 class 등을 사용하여 css 태그로 적용할 수 있는 방법이 있다.

반응형